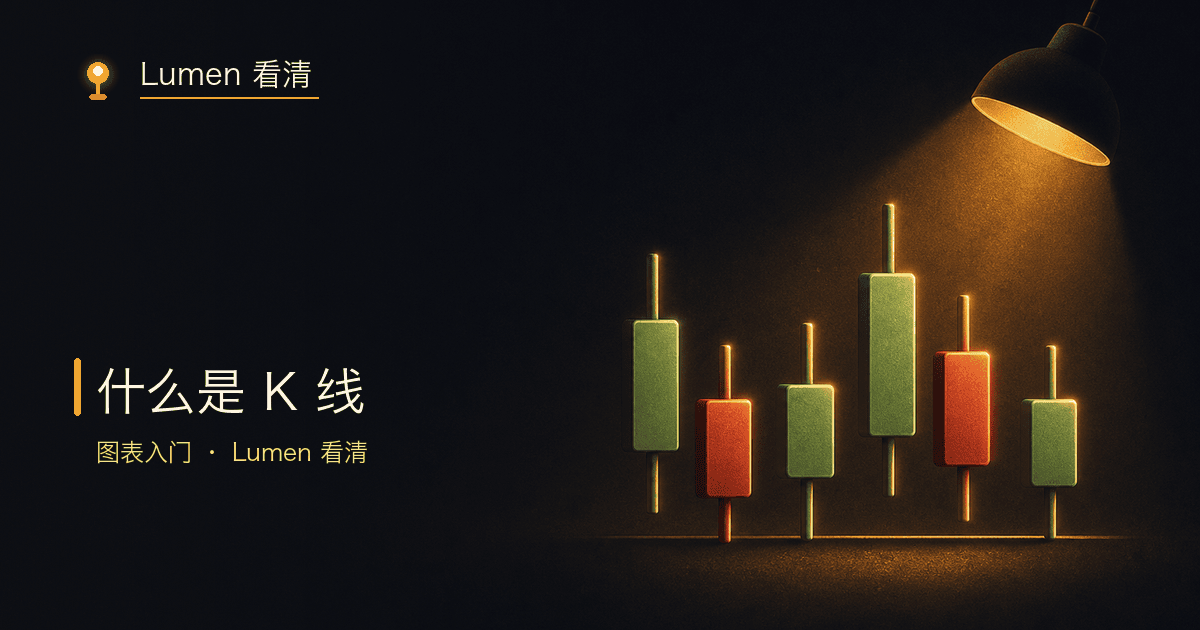
The first time you open a price chart, the screen full of little red and green bars can be intimidating: what are these? what are they trying to tell me? Those little bars are candlesticks (a candlestick chart), the most basic piece of reading a chart. They're less mysterious than they look — a single candle really just tells you four things about price over a slice of time. This lesson makes those four things clear and leaves everything else for later.
- One-line answer: a candlestick chart records price ups and downs with a series of "candles," each one representing the open, close, high, and low of a slice of time.
- One candle = four prices over a fixed slice of time: open, close, high, low.
- The thick middle is the body; the thin lines above and below are the wicks; the body's ends are the open and close.
- In most Western markets and crypto apps, green is up and red is down — but colors are configurable, so check the chart's setting first.
- Don't let one short-timeframe candle drag your emotions around. A candle is a record, not a prophecy.
A single candle holds four prices
Each candlestick represents a fixed slice of time — it could be one hour, or one day. During that window the price moves around, and the candle compresses it into four numbers: the open is the price at the start of the window, the close is the price at the end, the high is the peak it reached, and the low is the bottom it touched.
These four prices sit in fixed positions on the chart. The chunky bar in the middle is the body, and its top and bottom edges are the open and close; the thin lines poking out above and below are the wicks (also called shadows), and their tips mark the high and low of that window.
Green and red: the colors aren't universal
This is the spot beginners get tripped up, so get it straight first. A candle uses color to show whether the window was up or down — but the convention isn't the same everywhere. In most U.S. and Western markets, green means the close was higher than the open (up), and red means it was lower (down). That's the default you'll see on TradingView and on most crypto exchange charts. But in China and several other Asian markets the convention is flipped: red is up, green is down (red being an auspicious, "rising" color).
Crypto apps usually let you set the colors yourself, and they often default to green-up/red-down. So before reading any chart, confirm what its red and green actually mean — don't assume on instinct, because reading the direction backwards leads to embarrassing — or costly — mistakes.
Don't let one short candle drag your emotions
Beginners who just learned candles often fall into a habit: they stare at a one-minute chart, their pulse jumping with every flicker — panicking when it's red, chasing when it's green. That's exactly the state to guard against.
Remember one thing: a candle is a record of price that already happened, not a prediction of the future. A single short-timeframe candle tells you only what happened in the last few minutes; it can't tell you what the next one will do. The shorter the timeframe you watch, the more easily random noise toys with your emotions and pushes you into impulsive trades — and every impulsive trade both costs you a fee (see understanding fees) and tends to mistime your entries and exits.
If you really want to get to know candlesticks, looking at them a hundred times in an article matters less than opening a live chart and clicking around. Hover over candles, switch between minute, hour, and day timeframes, and see what the same stretch of time looks like at each — you'll get a feel for it fast. If you don't have a place to practice yet, get the basic operations down with our first-purchase walkthrough and learn to read charts while you operate.
The lesson, summed up
Stripped down, a candlestick isn't mystical: one candle, four prices, a body in the middle and wicks at the ends; check the color convention first (Western and Asian markets are opposite); and it records the past, it doesn't foretell the future. Hold these few points and you can read the most basic language of a price chart. Save the fancier patterns and indicators for when you're no longer being yanked around by short-timeframe emotion. To check whether you're ready to enter, first run through the pre-entry readiness checklist.